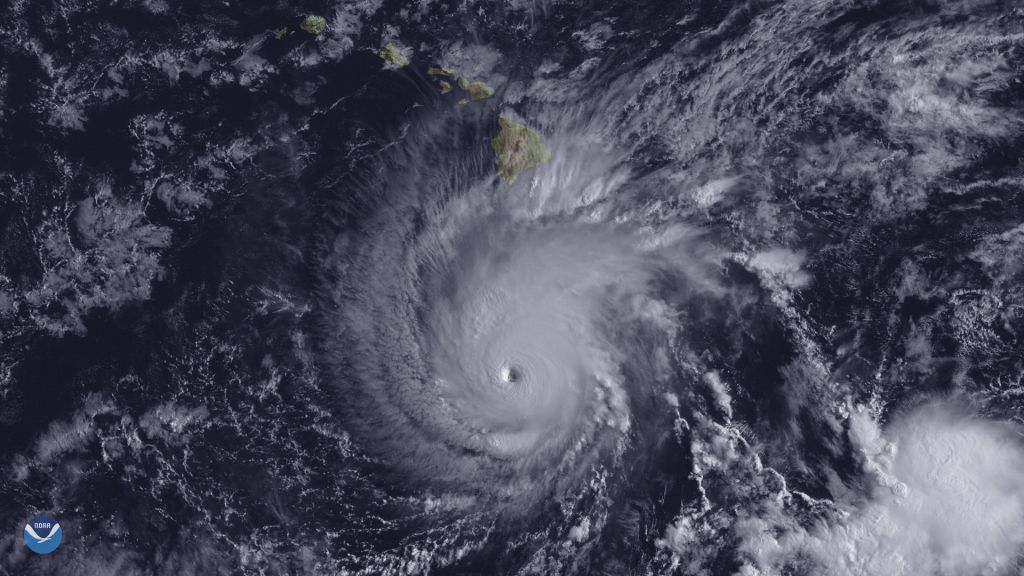
Satellites are key to tracking hurricanes and giving sufficient warning to reduce damages and loss of life. Hurricane Lane, a rare major storm in the central Pacfic, is heading towards Hawaii and is being watched by satellites in GEO as well as by the ISS.
- NASA Analyzes a Solid Ring of Cold Cloud Tops In Hurricane Lane | NASA
- Hurricane Lane – NASA/Flickr – Gallery of images of Lane from space
- NOAA National Environmental Satellite, Data, and Information Service (NESDIS)
- Hurricane Lane likely to skirt Hawaiian islands, but flooding probable – Ars Technica – Aug.23.2018
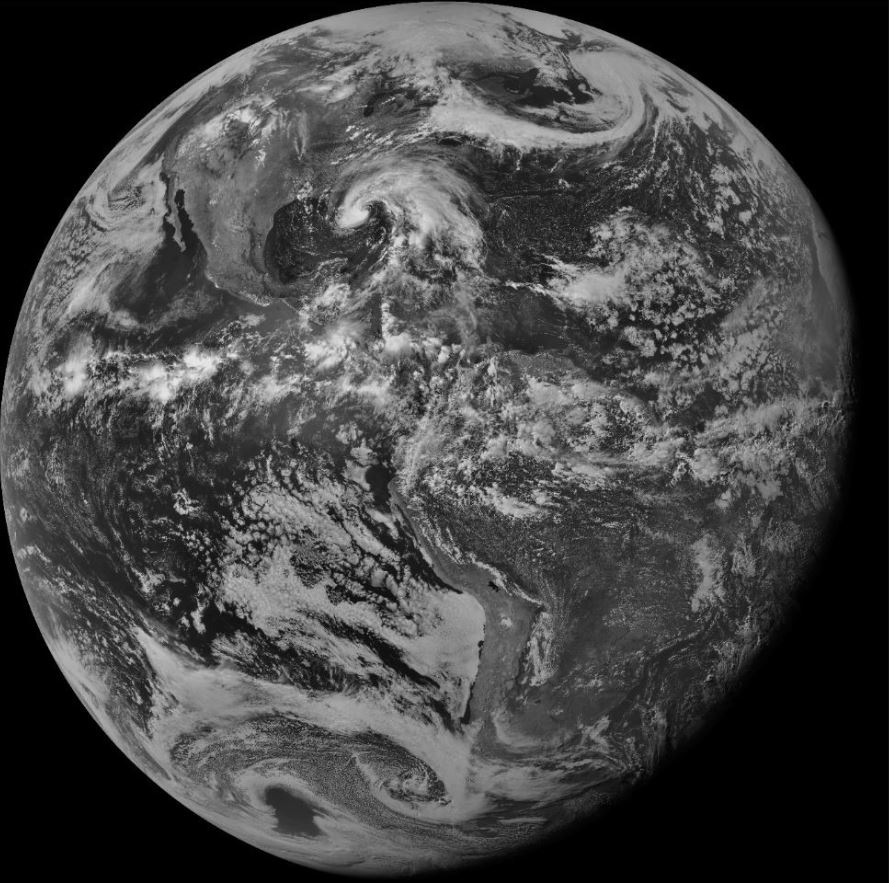
** Hurricane Lane from the ISS
Hurricane Lane was pictured by an Expedition 56 crew member as the International Space Station orbited nearly 250 miles above the Central Pacific Ocean on Aug. 22, 2018.

** NOAA satellite image – Aug.23.2018
** GOES satellite image time lapse of Lane movement on Aug.22.201
** Major Hurricane Lane Heads Toward Hawaii – (NESDIS – Aug.22.2018
** NASA ISS video:
— Intl. Space Station (@Space_Station) August 22, 2018
** NASA’s GPM Sees Hurricane Lane Threatening Hawaiian Islands With Heavy Rainfall
On Aug. 22 at 1:48 a.m. EDT (0548 UTC) the Global Precipitation Measurement mission or GPM core satellite passed over Hurricane Lane when it was a Category 5 hurricane in the Central Pacific Ocean. GPM found very heavy rain occurring in powerful storms located in Lane’s well defined eye wall. Moderate to heavy rainfall was also covering a large area extending outward from the eye. Credit: NASA/JAXA, Hal Pierce
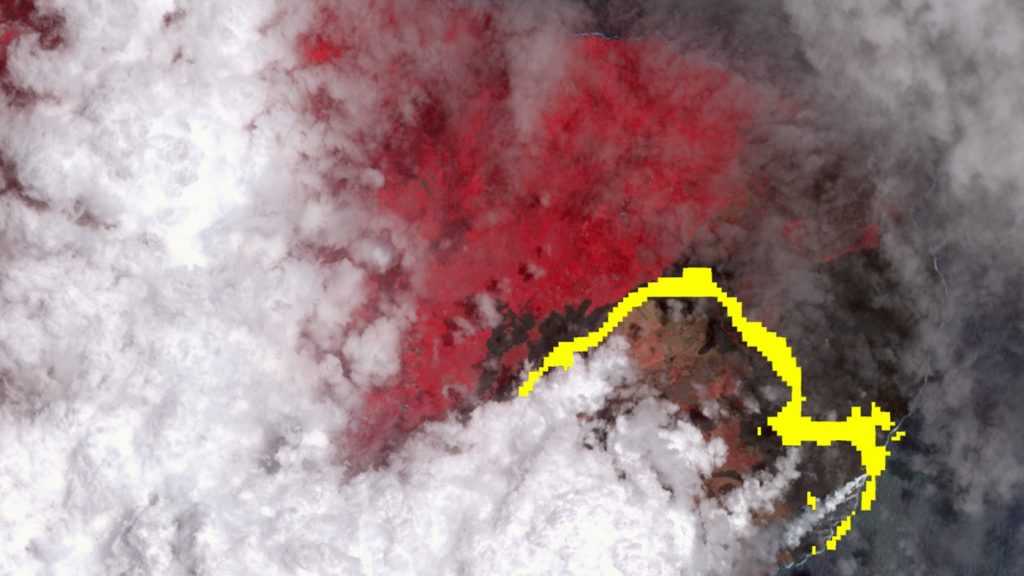
** NASA-NOAA’s Suomi NPP Satellite Views Category 5 Hurricane Lane
On Aug. 22 at 8:08 a.m. EDT (0208 HST/1208 UTC) The VIIRS instrument aboard NASA-NOAA’s Suomi NPP Satellite passed over Hurricane Lane when it was a Category 5 storm in the Central Pacific Ocean. Suomi NPP provided night-time and infrared imagery that showed the eye, gravity waves, and feeder bands of thunderstorms wrapping into the eye. Image Credit: UWM-CIMSS/William Straka III.

====