Here is a sampling of satellite images of recent events in the US and Europe:
** Fires in California: US weather satellites view wildfires in California: Geostationary Operational Environmental Satellite (GOES) 16 and 17: Monitoring storm systems and California’s wildfires | WHNT.com
The past 24 hours of the #CarrFire, as seen by @NOAASatellites #GOES16. The left panel shows visible light, the right thermal emission. Our hearts go out to those affected by the fire, and we’re posting overhead videos every hour at https://t.co/JaVHfFB8vt pic.twitter.com/djfJFB0PkN
— Descartes Labs (@DescartesLabs) July 28, 2018
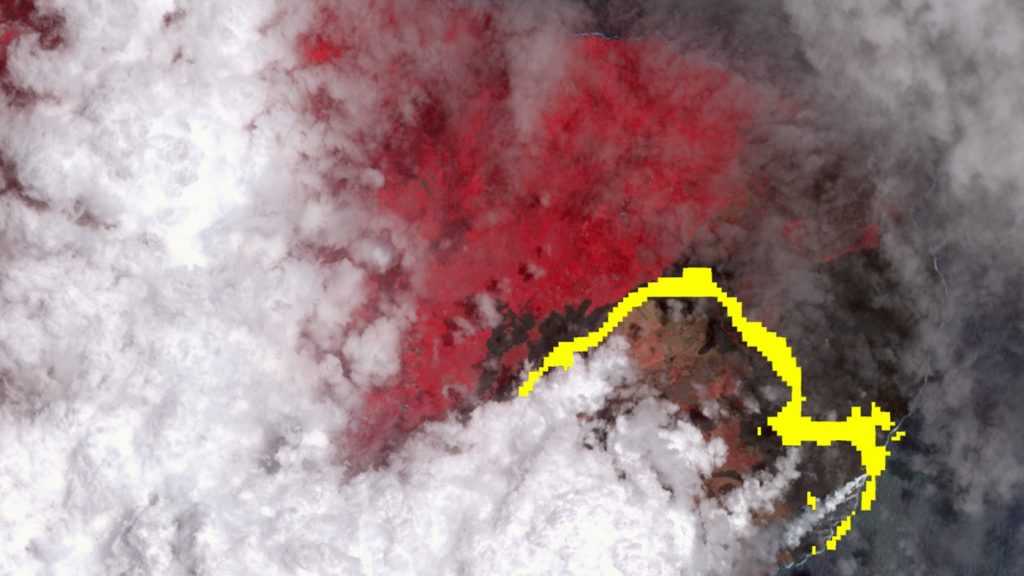
The @UWCIMSS satellite blog with imagery of the CA Cranston Fire as seen by #Goes16 Visible 0.64 µm and Shortwave IR 3.9 µm. Images show smoke and pyrocumulus clouds as well as thermal anomaly or “hot spot” (red pixels) associated with the fire: https://t.co/iS1uGtNkPD @UW_AOS pic.twitter.com/Kdr2yS1Rbn
— UW-Madison SSEC (@UWSSEC) July 26, 2018
More about satellite imaging of the US West Coast fires from space at NASA Satellite Sees Fires Up and Down U.S. West Coast | NASA.
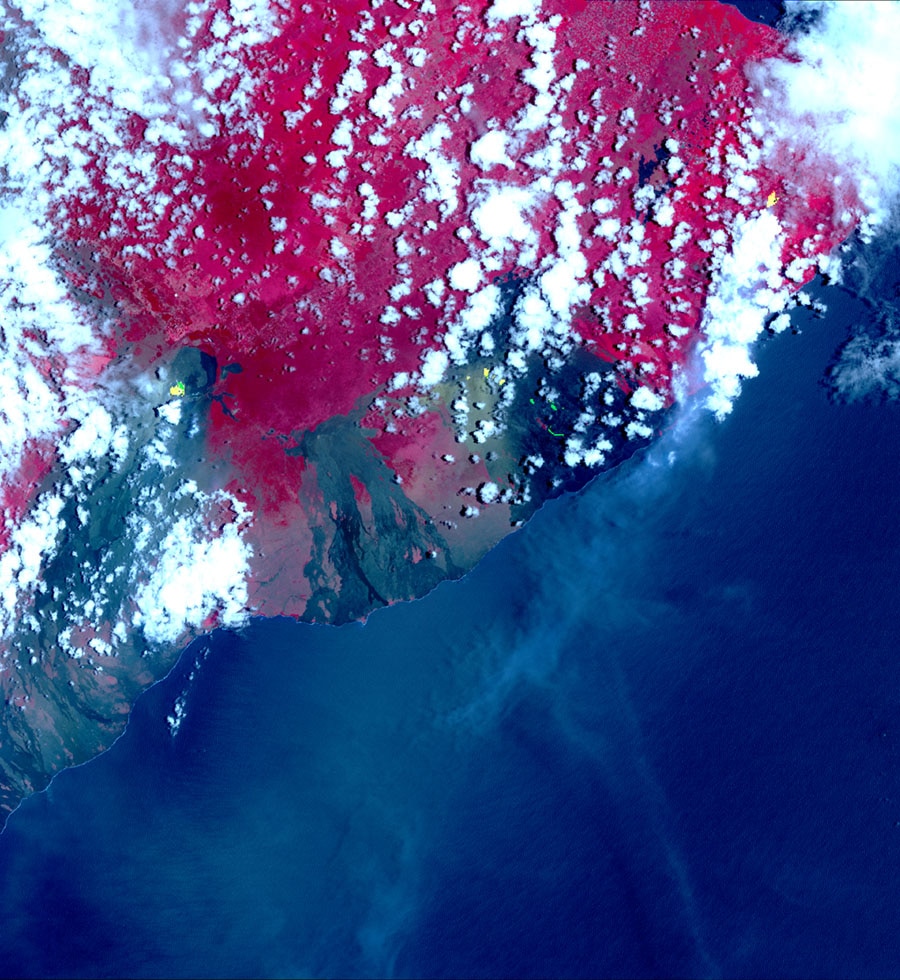
** Volcano lava flows in Hawaii: NASA satellite captures lava destruction from Kilauea volcano – CNET
› Full image and caption
Another image from Satellite View of Kilauea Eruption – NASA JPL:
** Fires in Greece: DigitalGlobe shows images of the sites in Greece where wildfires hit suddenly.
We captured imagery of the devastating #wildfires near Rafina, #Greece. Infrared images show burned areas in gray/black and healthy vegetation in red. #greecewildfires https://t.co/33JbSFSsh4 pic.twitter.com/60hnPqxt0O
— DigitalGlobe (@DigitalGlobe) July 26, 2018
This article includes side by side views with sliders to compare before and after the fires: Satellite images show the intensity of the flames that devastated coastal Greece — Quartz
** Europe’s summer heatwave:
As this year’s heatwave continues, the Copernicus Sentinel-3 mission reveals once again how the colour of our vegetation has changed in just one month. These two images cover the same area: part of Ireland, the UK, the Netherlands, Belgium, part of Germany and part of France, but the difference between them couldn’t be more striking. The first, captured on 28 June 2018, is predominantly green, depicting healthy vegetation. The second, captured on 25 July 2018, however, is mainly brown, showing just how much the vegetation has changed owing to the long hot dry spell Europe has been enduring over the last weeks.
These two images were captured by Sentinel-3’s ocean and land colour instrument. See also similar captures over Germany, Denmark and Sweden: European drought.
====