Category Archives: Eyes in the Sky

New night lights maps of the earth released by NASA

NASA has recently released new improved images and video of night-time views of the earth’s surface lighting.

New Night Lights Maps Open Up Possible Real-Time Applications

NASA scientists have just released the first new global map of Earth at night since 2012. By studying Earth at night, researchers can investigate how cities expand, monitor light intensity to estimate energy use and economic activity, and aid in disaster response.
Credits: NASA’s Goddard Space Flight Center/Kathryn Mersmann

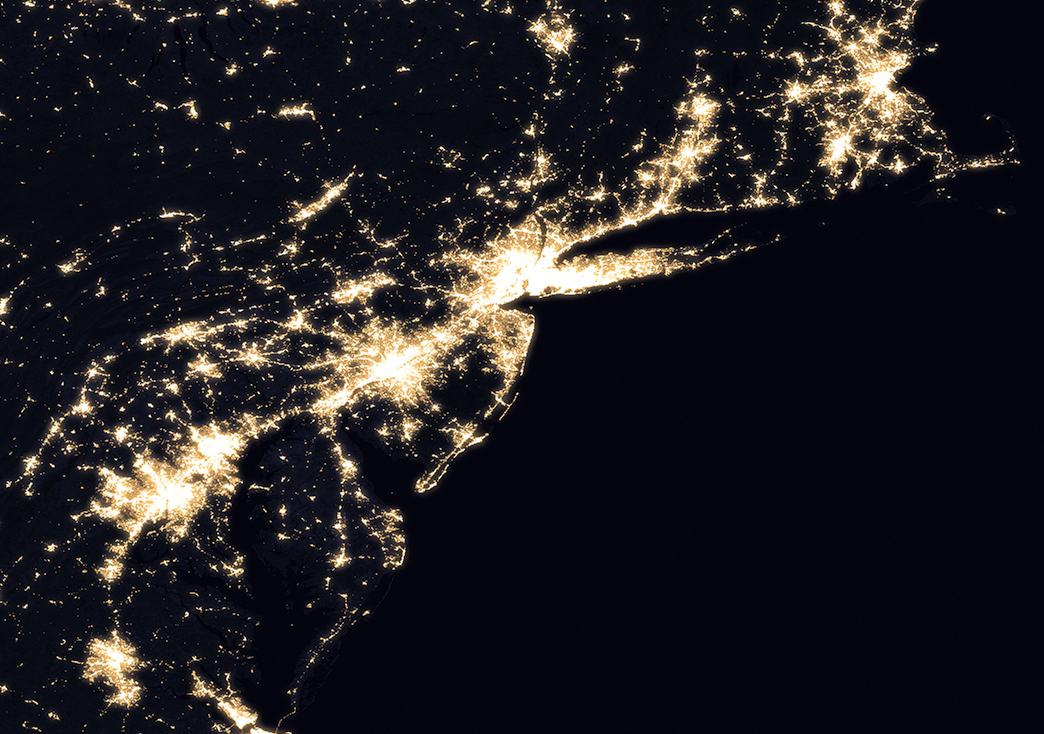
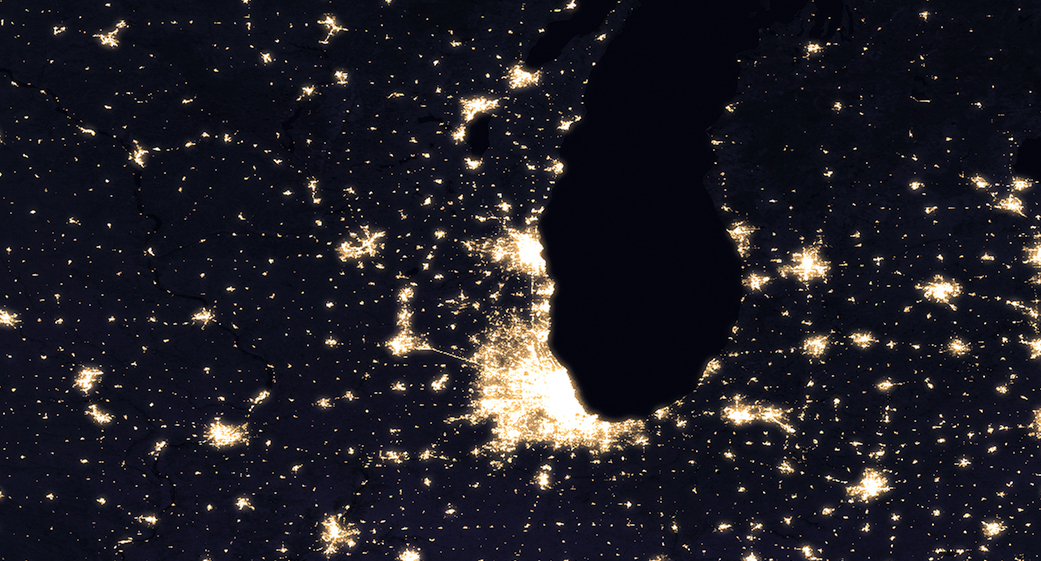
NASA scientists are releasing new global maps of Earth at night, providing the clearest yet composite view of the patterns of human settlement across our planet.

Satellite images of Earth at night — often referred to as “night lights” — have been a gee-whiz curiosity for the public and a tool for fundamental research for nearly 25 years. They have provided a broad, beautiful picture, showing how humans have shaped the planet and lit up the darkness. Produced every decade or so, such maps have spawned hundreds of pop-culture uses and dozens of economic, social science and environmental research projects.

These three composite images provide full-hemisphere views of Earth at night. The clouds and sun glint — added here for aesthetic effect — are derived from MODIS instrument land surface and cloud cover products. Credits: NASA Earth Observatory images by Joshua Stevens, using Suomi NPP VIIRS data from Miguel Román, NASA’s Goddard Space Flight Center Download Americas image – Download Europe and Africa imageDownload Asia and Australia image

But what would happen if night lights imagery could be updated yearly, monthly or even daily? A research team led by Earth scientist Miguel Román of NASA’s Goddard Space Flight Center in Greenbelt, Maryland, plans to find out this year.

In the years since the 2011 launch of the NASA-NOAA Suomi National Polar-orbiting Partnership (NPP) satellite, Román and colleagues have been analyzing night lights data and developing new software and algorithms to make night lights imagery clearer, more accurate and readily available. They are now on the verge of providing daily, high-definition views of Earth at night, and are targeting the release of such data to the science community later this year.

Composite image of continental U.S. at night, 2016. Credits: NASA Earth Observatory images by Joshua Stevens, using Suomi NPP VIIRS data from Miguel Román, NASA’s Goddard Space Flight Center

Since colleagues from the National Oceanic and Atmospheric Administration and NASA released a new Earth at night map in 2012, Román and teammates at NASA’s Earth Observing Satellite Data and Information System (EOSDIS) have been working to integrate nighttime data into NASA’s Global Imagery Browse Services (GIBS) and Worldview mapping tools. Freely available to the science community and the public via the Web, GIBS and Worldview allow users to see natural- and false-color images of Earth within hours of satellite acquisition.

Composite image of Mid-Atlantic and Northeastern U.S. at night, 2016. Credits: NASA Earth Observatory images by Joshua Stevens, using Suomi NPP VIIRS data from Miguel Román, NASA’s Goddard Space Flight Center

Today they are releasing a new global composite map of night lights as observed in 2016, as well as a revised version of the 2012 map (8 MB jpg | 265 MB jpg). The NASA group has examined the different ways that light is radiated, scattered and reflected by land, atmospheric and ocean surfaces. The principal challenge in nighttime satellite imaging is accounting for the phases of the moon, which constantly varies the amount of light shining on Earth, though in predictable ways. Likewise, seasonal vegetation, clouds, aerosols, snow and ice cover, and even faint atmospheric emissions (such as airglow and auroras) change the way light is observed in different parts of the world. The new maps were produced with data from all months of each year. The team wrote code that picked the clearest night views each month, ultimately combining moonlight-free and moonlight-corrected data.

Composite image of Nile River and surrounding region at night, 2016. Credits: NASA Earth Observatory images by Joshua Stevens, using Suomi NPP VIIRS data from Miguel Román, NASA’s Goddard Space Flight Center

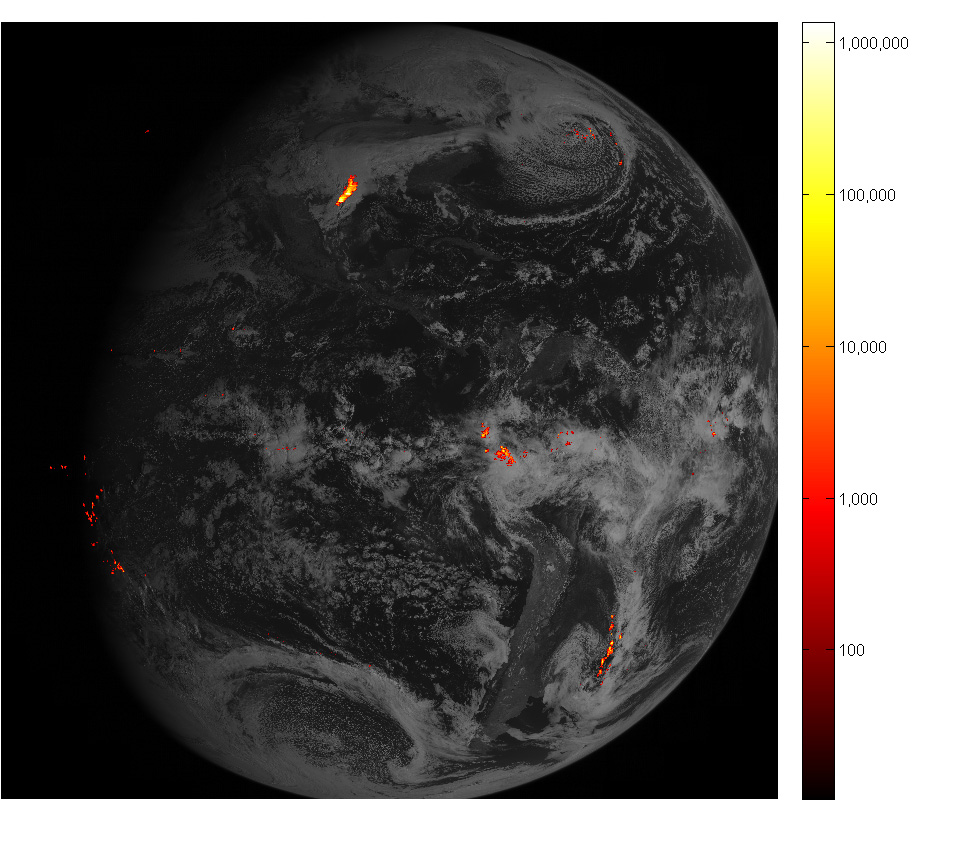
Román and colleagues have been building remote sensing techniques to filter out these sources of extraneous light, gathering a better and more consistent signal of how human-driven patterns and processes are changing. The improved processing moves Suomi NPP closer to its full potential of observing dim light down to the scale of an isolated highway lamp or a fishing boat. The satellite’s workhorse instrument is the Visible Infrared Imaging Radiometer Suite (VIIRS), which detects photons of light reflected from Earth’s surface and atmosphere in 22 different wavelengths. VIIRS is the first satellite instrument to make quantitative measurements of light emissions and reflections, which allows researchers to distinguish the intensity, types and the sources of night lights over several years.

Composite image of Europe at night, 2016.

Suomi NPP observes nearly every location on Earth at roughly 1:30 p.m. and 1:30 a.m. (local time) each day, observing the planet in vertical 3000-kilometer strips from pole to pole. VIIRS includes a special “day-night band,” a low-light sensor that can distinguish night lights with six times better spatial resolution and 250 times better resolution of lighting levels (dynamic range) than previous night-observing satellites. And because Suomi NPP is a civilian science satellite, the data are freely available to scientists within minutes to hours of acquisition.

[Chicago and Lake Michigan area in 2016. See NASA posting for comparison with 2012 image of same area.]

[India in 2016. See NASA posting for comparison with 2012 image of same area.]
Armed with more accurate nighttime environmental products, the NASA team is now automating the processing so that users will be able to view nighttime imagery within hours of acquisition. This has the potential to aid short-term weather forecasting and disaster response.

“Thanks to VIIRS, we can now monitor short-term changes caused by disturbances in power delivery, such as conflict, storms, earthquakes and brownouts,” said Román. “We can monitor cyclical changes driven by reoccurring human activities such as holiday lighting and seasonal migrations. We can also monitor gradual changes driven by urbanization, out-migration, economic changes, and electrification. The fact that we can track all these different aspects at the heart of what defines a city is simply mind-boggling.”

For instance, VIIRS detected power outages in the wake of Hurricane Matthew, a major storm that struck the northeastern Caribbean and the southeastern United States in late September 2016. NASA’s Disasters Response team provided the data to colleagues at the Federal Emergency Management Agency; in the future, NASA, FEMA and the Department of Energy hope to develop power outage maps and integrate the information into recovery efforts by first responders.

The NASA team envisions many other potential uses by research, meteorological and civic groups. For instance, daily nighttime imagery could be used to help monitor unregulated or unreported fishing. It could also contribute to efforts to track sea ice movements and concentrations. Researchers in Puerto Rico intend to use the dataset to reduce light pollution and help protect tropical forests and coastal areas that support fragile ecosystems. And a team at the United Nations has already used night lights data to monitor the effects of war on electric power and the movement of displaced populations in war-torn Syria.

In a separate, long-term project, Román is working with colleagues from around the world to improve global and regional estimates of carbon dioxide emissions. The team at NASA’s Global Modeling and Assimilation Office (GMAO) is combining night lights, urban land use data, and statistical and model projections of anthropogenic emissions in ways that should make estimates of sources much more precise.

Related Links

====

Students use Sally Ride EarthKAM on ISS to take snapshots around the globe

The Sally Ride EarthKAM is a camera set up on the International Space Station (ISS) to image the surface of the earth through a station window. What images the camera captures is controlled by students at middle schools in many different countries.

Last week, astronauts on the ISS installed and activated the camera: ISS Daily Summary Report – 3/30/2017 | ISS On-Orbit Status Report –

Sally Ride Earth Knowledge Acquired by Middle Schools (EarthKAM): This morning the crew successfully installed and activated the EarthKAM payload in the Node 2 nadir hatch window. Science operations using the EarthKAM setup will begin next week, marking the beginning of the 57th EarthKAM mission.

This session includes over 200 schools in more than 50 countries around the world and is scheduled to last through April 9. This is a NASA education program that enables thousands of students to photograph and examine Earth from a space crew’s perspective.

Using the Internet, the students control a special digital camera mounted on-board the ISS. This enables them to photograph the Earth’s coastlines, mountain ranges and other geographic items of interest from the unique vantage point of space.

The team at Sally Ride EarthKAM then posts these photographs on the Internet for the public and participating classrooms around the world to view.

Check out the image gallery for the latest Mission. Some samples:

Myanmar, Asia - EarthKam - March 30, 2017
Myanmar, Asia – EarthKam – March 30, 2017


Coast of South Africa – EarthKam – March 30, 2017


A view of the coast of India. March30, 2017

====

Video: GOES-16 images lightning flashes

The new GOES-16 weather satellite has many instruments for monitoring and studying events and processes happening in earth’s atmosphere. One of these instruments is specialized to detect and record lightning flashes.

Flashy First Images Arrive from NOAA’s GOES-16 Lightning Mapper
Satellite’s instrument will help forecasters pinpoint severe storms sooner

Detecting and predicting lightning just got a lot easier. The first images from a new instrument onboard NOAA’s GOES-16 satellite are giving NOAA National Weather Service forecasters richer information about lightning that will help them alert the public to dangerous weather.

The first lightning detector in a geostationary orbit, the Geostationary Lightning Mapper (GLM), is transmitting data never before available to forecasters. The mapper continually looks for lightning flashes in the Western Hemisphere, so forecasters know when a storm is forming, intensifying and becoming more dangerous. Rapid increases of lightning are a signal that a storm is strengthening quickly and could produce severe weather.

During heavy rain, GLM data will show when thunderstorms are stalled or if they are gathering strength. When combined with radar and other satellite data, GLM data may help forecasters anticipate severe weather and issue flood and flash flood warnings sooner. In dry areas, especially in the western United States, information from the instrument will help forecasters, and ultimately firefighters, identify areas prone to wildfires sparked by lightning.

This image shows lightning data captured on February 14, 2017 over the course of an hour and displayed over an image of the Western Hemisphere from the Advanced Baseline Imager on GOES-16. Brighter colors indicate more lightning energy was recorded; color bar units are the calculated kilowatt-hours of total optical emissions from lightning. The brightest storm system is located over the Gulf Coast of Texas, the same storm system in the accompanying video.

Accurate tracking of lightning and thunderstorms over the oceans, too distant for land-based radar and sometimes difficult to see with satellites, will support safe navigation for aviators and mariners.

The new mapper also detects in-cloud lightning, which often occurs five to 10 minutes or more before potentially deadly cloud-to-ground strikes. This means more precious time for forecasters to alert those involved in outdoor activities of the developing threat.

Learn more about GOES-16 and all its exciting possibilities for weather forecasting improvements by visiting the GOES-16 website & to download the MP4 video click here.

===

These two GOES-16 video don’t come from the lightning mapper but they do highlight the sharp resolution of the satellite’s storm imaging:

====

Satellite images of the Oroville dam

Images from a DigitalGlobe satellite show the effects of the high water runoff through the spillway at the Oroville Dam in northern California: DigitalGlobe on Twitter:  “Before and after imagery of the #OrovilleDam.

Lots more images of the dam and the lake, including a shot during the drought: Dramatic Satellite Images Show the Oroville Dam From Drought to Overflow – Gizmodo.

Video: Watch 104 satellites being thrown into orbit

An Indian PSLV (Polar Satellite Launch Vehicle) rocket put 104 satellites into orbit yesterday. (See previous posting.) These include 88 smallsats for the earth observation company Planet, 8 smallsats for Spire, which is doing maritime tracking and weather measurements, and 1 for SpacePharma, which has a miniature laboratory on its satellite for carrying out microgravity experiments.

This video shows the launch and then provides some amazing views of the satellites being deployed into orbit:

====