ESO: Exploring the wilds of the Local Group (of galaxies)

The latest report from the European Southern Observatory (ESO)

The Wilds of the Local Group

This image, captured by ESO’s OmegaCAM on the VLT Survey Telescope, shows a lonely galaxy known as Wolf-Lundmark-Melotte, or WLM for short. Although considered part of our Local Group of dozens of galaxies, WLM stands alone at the group’s outer edges as one of its most remote members. In fact, the galaxy is so small and secluded that it may never have interacted with any other Local Group galaxy — or perhaps even any other galaxy in the history of the Universe.

This scene, captured by ESO’s OmegaCAM on the VLT Survey Telescope, shows a lonely galaxy known as Wolf-Lundmark-Melotte, or WLM for short. Although considered part of our Local Group of dozens of galaxies, WLM stands alone at the group’s outer edges as one of its most remote members. In fact, the galaxy is so small and secluded that it may never have interacted with any other Local Group galaxy — or perhaps even any other galaxy in the history of the Universe.

Rather like an uncontacted tribe living deep in the Amazon rainforest or on an island in Oceania, WLM offers a rare insight into the primordial nature of galaxies that have been little disturbed by their environment.

This sequence starts with a broad view of the rather faint constellation of Cetus (The Sea Monster). As we zoom, we close in on a faint galaxy, known as WLM. The final detailed image, captured with the OmegaCAM camera on ESO’s VLT Survey Telescope in Chile, shows the galaxy in great detail, including many of its component stars and some glowing clouds of hydrogen. Credit: ESO/A. Fujii/Digitized Sky Survey 2. Music: Johan B. Monell (www.johanmonell.com). Acknowledgement: VST/Omegacam Local Group Survey

WLM was discovered in 1909 by German astronomer Max Wolf, and identified as a galaxy some fifteen years later by astronomers Knut Lundmark and Philibert Jacques Melotte — explaining the galaxy’s unusual moniker. The dim galaxy is located in the constellation of Cetus (The Sea Monster) about three million light-years away from the Milky Way, which is one of the three dominant spiral galaxies in the Local Group.
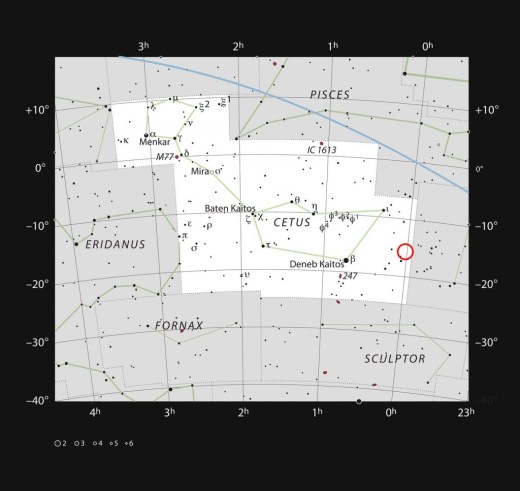
This chart shows the position of the faint, galaxy WLM in the constellation of Cetus (The Sea Monster). Most of the stars visible to the naked eye on a clear and dark night are shown. The galaxy itself has a very low surface brightness, it was discoved photographically in the early twentieth century and is very hard to spot visually.

WLM is quite small and lacks structure, hence its classification as a dwarf irregular galaxy. WLM spans about 8000 light-years at its greatest extent, a measurement that includes a halo of extremely old stars discovered in 1996 (eso9633).

Astronomers think that comparatively small primeval galaxies gravitationally interacted with each other and in many cases merged, building up into larger composite galaxies. Over billions of years, this merging process assembled the large spiral and elliptical galaxies that now appear to be common in the modern Universe. Galaxies congregating in this manner is similar to the way in which human populations have shifted over thousands of years and intermixed into larger settlements, eventually giving rise to today’s megacities.

This wide-field view shows the sky around the dwarf galaxy WLM in the constellation of Cetus (The Sea Monster). This picture was created from images forming part of the Digitized Sky Survey 2. The galaxy appears at the centre of the picture as an irregularly shaped clump of faint stars.

WLM has instead developed on its own, away from the influence of other galaxies and their stellar populations. Accordingly, like a hidden human population with limited contact with outsiders, WLM represents a relatively unperturbed “state of nature”, where any changes occurring over its lifetime have taken place largely independent of activity elsewhere.

This small galaxy features an extended halo of very dim red stars, which stretches out into the inky blackness of the surrounding space. This reddish hue is indicative of advanced stellar age. It is likely that the halo dates back to the original formation of the galaxy itself, helpfully offering clues about the mechanisms that spawned the very first galaxies.

This close-up video pan sequence, captured by ESO’s OmegaCAM on the VLT Survey Telescope, shows a lonely galaxy known as Wolf-Lundmark-Melotte, or WLM for short. Although considered part of our Local Group of dozens of galaxies, WLM stands alone at the group’s outer edges as one of its most remote members. In fact, the galaxy is so small and secluded that it may never have interacted with any other Local Group galaxy — or perhaps even any other galaxy in the history of the Universe. Credit: ESO. Music: Johan B. Monell (www.johanmonell.com). Acknowledgement: VST/Omegacam Local Group Survey

The stars at the centre of WLM, meanwhile, appear younger and bluer in colour. In this image, pinkish clouds highlight areas where the intense light from young stars has ionised ambient hydrogen gas, making it glow in a characteristic shade of red.

This detailed image was captured by the OmegaCAM wide-field imager, a huge camera mounted on ESO’s VLT Survey Telescope (VST) in Chile — a 2.6-metre telescope exclusively designed to survey the night sky in visible light. OmegaCAM’s 32 CCD detectors create 256-megapixel images, offering a very detailed wide-field view of the cosmos.

Dawn at Ceres: New images highlight bright spots and color differences on surface

The Dawn Mission unveils new images and findings at the dwarf planet Ceres in the asteroid belt:

Bright Spots and Color Differences Revealed on Ceres

Scientists from NASA’s Dawn mission unveiled new images from the spacecraft’s lowest orbit at Ceres, including highly-anticipated views of Occator Crater, at the 47th annual Lunar and Planetary Science Conference in The Woodlands, Texas, on Tuesday.

PIA20350-16-640x350[1]
Occator Crater, measuring 57 miles (92 kilometers) across and 2.5 miles (4 kilometers) deep, contains the brightest area on Ceres. Image Credit: NASA/JPL-Caltech/UCLA/MPS/DLR/IDA/PSI. Full Image and caption.
Occator Crater, measuring 57 miles (92 kilometers) across and 2.5 miles (4 kilometers) deep, contains the brightest area on Ceres, the dwarf planet that Dawn has explored since early 2015. The latest images, taken from 240 miles (385 kilometers) above the surface of Ceres, reveal a dome in a smooth-walled pit in the bright center of the crater. Numerous linear features and fractures crisscross the top and flanks of this dome. Prominent fractures also surround the dome and run through smaller, bright regions found within the crater.

“Before Dawn began its intensive observations of Ceres last year, Occator Crater looked to be one large bright area. Now, with the latest close views, we can see complex features that provide new mysteries to investigate,” said Ralf Jaumann, planetary scientist and Dawn co-investigator at the German Aerospace Center (DLR) in Berlin. “The intricate geometry of the crater interior suggests geologic activity in the recent past, but we will need to complete detailed geologic mapping of the crater in order to test hypotheses for its formation.”

PIA20352_ip[1]
Ceres’ Haulani Crater (21 miles, 34 kilometers wide) is shown in these views from the visible and infrared mapping spectrometer (VIR) aboard NASA’s Dawn spacecraft. These views reveal variations in the region’s brightness, mineralogy and temperature at infrared wavelengths. The image at far left shows brightness variations in Haulani. Light with a wavelength of 1200 nanometers is shown in blue, 1900 nanometers in green and 2300 nanometers in red. The view at center is a false color image, highlighting differences in the types of rock and ejected material around the crater. Scientists see this as evidence that the material in this area is not uniform, and that the crater’s interior has a different composition than its surroundings. This is what scientists call a color ratio image (blue: 3200/3300 nanometers, green: 2900/3100 nanometers, red: 2600/2700 nanometers). The image at right shows information related to temperature. Bluer regions are colder zones and redder regions are warmer. The colors demonstrate that the interior of Haulani appears colder than its surroundings. Light with a wavelength of 2700 nanometers is shown in blue, 2000 nanometers in green and 5000 nanometers in red.
Color Differences

The team also released an enhanced color map of the surface of Ceres, highlighting the diversity of surface materials and their relationships to surface morphology. Scientists have been studying the shapes of craters and their distribution with great interest. Ceres does not have as many large impact basins as scientists expected, but the number of smaller craters generally matches their predictions. The blue material highlighted in the color map is related to flows, smooth plains and mountains, which appear to be very young surface features.

PIA20355_ip[1]
The bright central spots near the center of Occator Crater are shown in enhanced color in this view from NASA’s Dawn spacecraft. Such views can be used to highlight subtle color differences on Ceres’ surface. Lower resolution color data have been overlaid onto a higher resolution view (see PIA20350) of the crater. The view was produced by combining the highest resolution images of Occator obtained in February 2016 (at image scales of 35 meters, or 115 feet, per pixel) with color images obtained in September 2015 (at image scales of 135 meters, or about 440 feet, per pixel). The three images used to produce the color were taken using spectral filters centered at 438, 550 and 965 nanometers (the latter being slightly beyond the range of human vision, in the near-infrared). The crater measures 57 miles (92 kilometers) across and 2.5 miles (4 kilometers) deep. Dawn’s close-up view reveals a dome in a smooth-walled pit in the bright center of the crater. Numerous linear features and fractures crisscross the top and flanks of this dome.
“Although impact processes dominate the surface geology on Ceres, we have identified specific color variations on the surface indicating material alterations that are due to a complex interaction of the impact process and the subsurface composition,” Jaumann said. “Additionally, this gives evidence for a subsurface layer enriched in ice and volatiles.”

PIA20351_ip[1]
This global map shows the surface of Ceres in enhanced color, encompassing infrared wavelengths beyond human visual range. Images taken using infrared (965 nanometers), green (555 nanometers) and blue (438 nanometers) spectral filters were combined to create this view. This type of map is known as an elliptical, or Mollweide, projection and has a resolution of 460 feet (140 meters) per pixel. Some areas near the poles are black where Dawn’s color imaging coverage is incomplete. The images used to make this map were taken from Dawn’s high-altitude mapping orbit (HAMO), at a distance of 915 miles (1,470 kilometers) from Ceres.
Counting Neutrons

Data relevant to the possibility of subsurface ice is also emerging from Dawn’s Gamma Ray and Neutron Detector (GRaND), which began acquiring its primary data set in December. Neutrons and gamma rays produced by cosmic ray interactions with surface materials provide a fingerprint of Ceres’ chemical makeup. The measurements are sensitive to elemental composition of the topmost yard (meter) of the regolith.

PIA20353_ip[1]
This map shows a portion of the northern hemisphere of Ceres with neutron counting data acquired by the gamma ray and neutron detector (GRaND) instrument aboard NASA’s Dawn spacecraft. These data reflect the concentration of hydrogen in the upper yard (or meter) of regolith, the loose surface material on Ceres. The color information is based on the number of neutrons detected per second by GRaND. Counts decrease with increasing hydrogen concentration. The color scale of the map is from blue (lowest neutron count) to red (highest neutron count). Lower neutron counts near the pole suggest the presence of water ice within about a yard (meter) of the surface at high latitudes. The GRaND data were acquired from Dawn’s low-altitude mapping orbit (LAMO) at Ceres, a distance of 240 miles (385 kilometers) from the dwarf planet. Ceres’ north pole is marked with a white line. The longitude is centered on Occator Crater.
In Dawn’s lowest-altitude orbit, the instrument has detected fewer neutrons near the poles of Ceres than at the equator, which indicates increased hydrogen concentration at high latitudes. As hydrogen is a principal constituent of water, water ice could be present close to the surface in polar regions.

“Our analyses will test a longstanding prediction that water ice can survive just beneath Ceres’ cold, high-latitude surface for billions of years,” said Tom Prettyman, the lead for GRaND and Dawn co-investigator at the Planetary Science Institute, Tucson, Arizona.


“A New Moon Rises” – An exhibition of HD images of the lunar surface

NASA’s Lunar Reconnaissance Orbiter has been circling the Moon since June 2009 and has been imaging the lunar surface at much higher resolution than obtained during previous missions going back to the Apollo era. The images can be quite spectacular and some of the most striking are currently on display in an exhibition called A New Moon Rises at the National Air and Space Museum in Washington D.C. Here is a report on the show: Desolate magnificence – The Space Review.

Below is a sampling of the CratersVistas, and Major Discoveries on display:

The image below shows “A Very Young Crater”  with [spectacular] ejecta surround it. The crater is

about 1,400 meters (4,600 feet) across. Since there are no superimposed impact craters on the ejecta, and the delicate lacy impact spray is still preserved near the rim, this crater formed very recently, perhaps sometime in the past few thousand years.

Young Impact Crater - 11865p

Below are two “Copernican Craters” that have

… large, spectacular ejecta patterns of bright material thrown across the Moon’s surface. These craters are no more than 1 billion years old—”Copernican age” in the lunar geologic timescale. Because they are so bright and have few impact craters on them, they may be as young as a few million years. Each is incredibly well preserved: crisp crater rims, steep crater walls, and delicate small-scale ejecta patterns. The overhead sunlight highlights the brightness variations.

Copernican Crater - 11863p

Copernican Crater - 11864p

The lunar feature below is titled, “The Strangest of Swirls”

Reiner Gamma is one of the Moon’s most distinctive and mysterious features. This striking, tadpole-shaped swirl puzzles lunar scientists. Some think that its origin, as with other swirls, is somehow related to the shielding effects of localized magnetic field anomalies.

Reiner Gamma-11843p

The images below

…, taken at different times, reveal that a cave extends at least 25 meters (82 feet) under the surface of the Moon. Collapse pits, where the near-surface lunar crust has caved in, can provide a window into the shallow subsurface. Image IDs: M126710873R, M155016845R, M152662021R

11829p[1]

Here is an entertaining video about how the LRO is operated:

The Space Show this week – Mar.21.16

The guests and topics of discussion on The Space Show this week:

1. Monday, March 21, 2016: 2-3:30 PM PDT (5-6:30 PM EDT, 4-5:30 PM CDT): We welcome CHRIS CARBERRY & RICK ZUCKER of ExploreMars, Inc. for updates.

2. Tuesday, March 22, 2016: 7-8:30 PM PDT (10-11:30 PM EDT, 9-10:30 PM CDT): We welcome back DR.MIKE GRIFFIN, former NASA Administrator for space policy moving forward.

3. Friday, March 25, 2016: 2016; 9:30-11AM PDT; (12:30-2 PM EDT; 11:30AM – 1 PM CDT. JOHN STRICKLAND returns for the final part of his three part series.

4. Sunday, March 27 2016: 12-1:30 PM PDT (3-4:30 PM EDT, 2-3:30 PM CDT): NO SHOW DUE TO EASTER.

See also:
* The Space Show on Vimeo – webinar videos
* The Space Show’s Blog – summaries of interviews.
* The Space Show Classroom Blog – tutorial programs

The Space Show is a project of the One Giant Leap Foundation.